Case Study #1: Asset Failures and Preventive Maintenance involves developing a predictive model that can forecast when an asset is likely to fail and require maintenance. The input data for the model can include information such as the age of the asset, the usage pattern, the environmental conditions, and the maintenance history. The model can then use this data to identify patterns and make predictions about when maintenance is needed. By predicting asset failures, the model can help organizations to schedule preventive maintenance proactively, reducing downtime and avoiding costly emergency repairs. The model can be updated and refined based on feedback and data analysis to continuously improve the accuracy of the predictions. Overall, such a model can help organizations to optimize their maintenance processes, reduce costs, and improve operational efficiency.

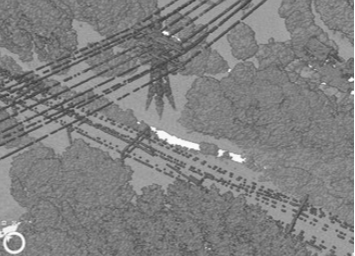
Case Study #2: Vegetation encroachment in 2D/3D involves developing a computer vision model that can accurately detect vegetation around utility infrastructure. The model can be built using deep learning techniques such as convolutional neural networks that can learn from large datasets of images. The input data for the model can include high-resolution aerial or satellite images of the infrastructure and the surrounding vegetation in 2D domain and LiDAR data in 3D domain. The model can then use these images to identify the boundaries of the infrastructure and the vegetation and measure the distance between them. By quantifying the vegetation encroachment, the model can help organizations to identify areas that need maintenance and prioritize their resources accordingly. Overall, such a model can help organizations to improve their maintenance planning and reduce the risk of damage to critical infrastructure.
Case Study #3: Power Outage involves developing a predictive model that can forecast when and where power outages are likely to occur. The model can be built using various machine learning techniques such as regression, decision trees, and neural networks. The input data for the model can include information such as weather conditions, load demand, maintenance schedules, and geographical location. The model can then use this data to identify patterns and make predictions about when and where power outages are most likely to occur. By predicting power outages, the model can help utility companies to proactively allocate resources and reduce downtime. Overall, such a model can help utility companies to improve their service reliability and minimize the impact of power outages on their customers.

Case Study #4: Driver Safety involves building machine learning models to identify risky drivers on the road. Such a process involves developing predictive models that can analyze various factors such as hard braking, speeding, and other driving behaviors that may increase the likelihood of accidents. The input data for the model can include sensor data from the vehicle, such as GPS, accelerometer, and speedometer readings, as well as data from external sources such as weather conditions and traffic patterns. The models can then be trained on historical data to identify patterns and make predictions about which drivers are more likely to engage in risky behaviors. Once the models are developed, they can be integrated into a real-time monitoring system that alerts fleet managers or drivers themselves to take corrective action when risky behavior is detected. By using machine learning models to identify risky drivers, organizations can improve safety on the road, reduce accidents, and lower insurance costs.

Case Study #5: Fault Location Model involves developing a predictive model that can analyze various factors such as crew location and existing outage locations to determine the most likely location of a power outage. The input data for the model can include crew location data, outage reports, and other relevant information such as weather conditions and infrastructure data. The model can then use this data to identify patterns and group similar incidents together based on their location and other relevant factors. This can help utility companies to allocate resources more efficiently and respond more quickly to outages, reducing downtime and improving customer satisfaction. Organizations can improve their outage response times, reduce costs, and improve overall service reliability.
Case Study #6: Asset Connectivity provides a clear and intuitive representation of the assets (e.g., wires, poles, transformers) in utility space. Graph model uses a graph that consists of nodes and edges to show asset connectivity. Each node represents an asset in the Unity space, such as pole, transformer, pole, and each edge represents a connection or relationship between the assets. Once the graph is created, we can use a graph visualization tool to display the graph and make it more intuitive and easy to understand. By using a graph model to represent asset connectivity in Unity space, developers and designers can quickly and easily understand the relationships between different assets and make informed decisions about the design and layout of the space. The graph model can also be updated and refined as new assets are added or existing assets are modified, ensuring that the representation remains accurate and up-to-date.

Case Study #7: Asset Storage & Tracking requires creating a comprehensive asset management solution to enable the utility to improve asset reliability, reduce downtime, and minimize the risk of equipment failure. The GIS system provides a spatial context for the assets, while the OsiSoft system provides a platform for collecting and analyzing time-series data from various sensors and devices. To implement this solution, the utility can first create a GIS database that contains information about the location and attributes of each asset, such as transformers, switchgear, and circuit breakers. The OsiSoft system can then be configured to collect time-series data from sensors and devices installed on these assets, such as temperature, voltage, and current measurements. By integrating the GIS and OsiSoft systems, the utility can create a unified platform that allows them to visualize and analyze both spatial and time-series data related to their assets to identify patterns and trends in the data, predict maintenance needs, and optimize asset performance. The solution can also include features such as real-time monitoring, alerts, and predictive analytics to provide early warning of potential issues and enable proactive maintenance.
